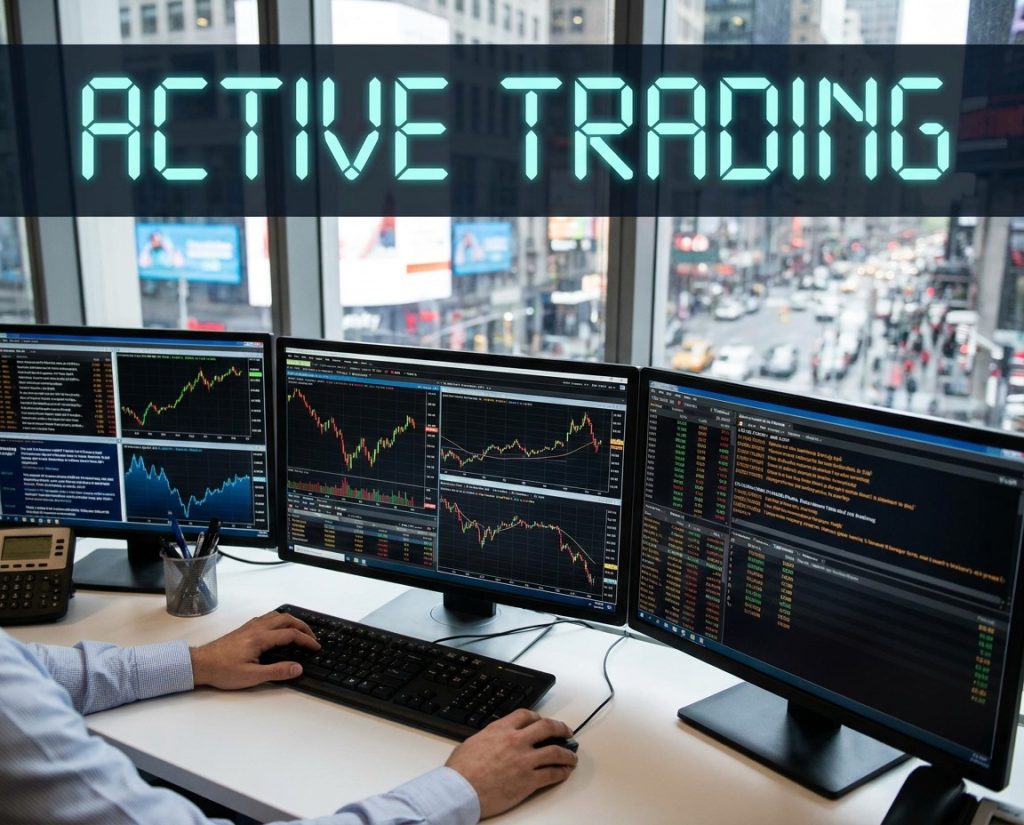
Active trading is the attempt to profit from market price movements by entering and exiting positions more frequently than a conventional long term investor. The holding period can range from seconds to several months, depending on the strategy, but the common feature is that the trader is making deliberate decisions about entries, exits and risk rather than simply buying an asset and expecting long term economic growth to do most of the work.
That distinction matters because active trading is not one strategy. Day trading describes a holding period. Scalping describes an especially short term approach within that broad category. Trend trading describes a method that can operate intraday or across several months. Momentum, mean reversion, breakout and event driven trading describe different reasons for entering positions. A trader can therefore be a day trader and a trend trader at the same time, or a swing trader using momentum.
Beginners often mix these labels together and then wonder why trading advice appears contradictory. A scalper may regard a 1% adverse move as enormous. A multiweek trend trader might consider it meaningless noise. Neither is necessarily wrong because their trades were designed around different timeframes.
The important question is not which trading style sounds most profitable. It is which method can be defined clearly enough to test, fits the market being traded and matches the trader’s available capital, time and temperament.
Active trading also comes with costs that long term investors encounter much less frequently. Spreads and commissions are repeatedly paid, slippage affects entries and exits, leverage can magnify losses and short holding periods leave less time for a profitable thesis to overcome execution costs. The US Securities and Exchange Commission has long warned that day trading can produce substantial losses, particularly when borrowed money is involved. SEC guidance on day trading describes the activity as highly risky and notes that many traders suffer severe losses during their early months.
Active trading can be approached methodically. It should not be confused with easy money.
What Active Trading Actually Means
Active trading sits somewhere between long term investment and pure market making, but there is no official holding period at which an investor suddenly becomes a trader. The difference is mainly one of intent and process.
An investor buying a diversified equity fund may expect to hold it for twenty years. Their return depends largely on the long term growth, income and valuation of the assets inside the fund. They do not need tomorrow’s price to confirm that the investment was sensible.
An active trader is more concerned with what price is likely to do over a defined shorter period. A trader might buy the same equity fund because the index has broken above a technical resistance level and expect to exit three days later. The underlying security is identical but the reason for owning it is completely different.
This creates one of the most common trading mistakes: entering a position with a short term reason and then switching to long term investment logic once it loses money. A trader buys a stock because of an intraday breakout. The breakout fails. Rather than closing the position, they decide the company has strong long term fundamentals and continue holding it.
Nothing prevents a trader from changing their opinion, but this behaviour often amounts to avoiding a realised loss rather than conducting a new investment analysis.
Active trading works better when the expected holding period, invalidation point and exit process are considered before the trade begins.
Trading Timeframe and Trading Strategy Are Not the Same Thing
Understanding the difference between timeframe and strategy makes the various types of active trading much easier to compare.
Day trading means positions are normally opened and closed during the same trading day. Swing trading generally involves holding for several days or weeks. Position trading can extend from weeks to months. Scalping compresses the holding period further and may last seconds or minutes.
Trend trading, momentum trading and mean reversion describe something else. They describe what the trader expects prices to do.
A trend trader expects an established directional movement to continue. A mean reversion trader expects price to move back toward some estimate of normal value after stretching too far in one direction. A momentum trader attempts to participate in strong movement while buying or selling pressure remains unusually persistent.
These ideas can exist on almost any timeframe.
A five minute EUR/USD chart can contain a trend. So can a weekly chart of the S&P 500. A trader can scalp momentum for thirty seconds or hold momentum shares for several weeks.
The distinction is useful because traders should compare methods operating under similar conditions. A five minute scalping result cannot be compared directly with a six month trend strategy simply because both traded the Nasdaq.
DayTrading.com provides a broader breakdown of trader types by strategy and holding period, including day traders and swing traders. The categories overlap in practice, but separating the timeframe from the entry logic is a good starting point.
Day Trading
Day trading means opening and closing a position during the same trading session. The trader generally avoids carrying the position overnight, although the exact meaning of a trading day depends on the instrument. US stocks have defined exchange sessions, while currencies and futures can trade across much longer daily windows.
The basic attraction is control over overnight risk. A stock can report unexpected news after the closing bell and open considerably higher or lower the following morning. A day trader who finishes the session in cash avoids that particular position risk.
The cost is that all of the expected return has to emerge within a relatively short period. Small price movements make transaction costs more important and leave less room for being approximately correct.
Suppose a day trader buys a stock at $50 and targets $50.40 while risking a decline to $49.80. The gross target is only 40 cents per share. The spread, commission and any slippage therefore represent a noticeable portion of the potential return. A long term investor expecting a stock to appreciate by $20 over several years is much less concerned about losing two cents to the spread.
Day traders often concentrate on the periods with the greatest liquidity and movement. In US equities, the market open attracts particular attention because overnight news, earnings announcements and accumulated orders are being reflected in price. The close can also be active as institutional orders and index related flows enter the market.
More movement does not automatically mean better trading. The opening minutes can also contain rapid reversals, wide spreads in less liquid securities and enough noise to punish traders who enter simply because something is moving.
A defined setup matters more than activity itself.
US Day Trading Rules Are Changing
US traders using securities margin accounts also need to know that the regulatory framework changed in 2026.
For years, the familiar Pattern Day Trader rules generally required customers classified as pattern day traders to maintain at least $25,000 of equity in a margin account. FINRA adopted replacement intraday margin requirements that became effective on June 4, 2026. Brokerage firms have a transition period through October 20, 2027, so some firms may still apply the old Pattern Day Trader framework while others move to the new rules earlier. Investor.gov’s current day trading margin guidance explains the transition and advises traders to check which regime their brokerage is currently using.
Under the replacement system, the old trade count based Pattern Day Trader designation and automatic $25,000 minimum are replaced by intraday margin requirements based more directly on the risk created inside the account. Brokers can still impose requirements stricter than the regulatory minimum.
This is an example of why active traders need to understand both their strategy and their account rules. A setup can be technically sound and still be impossible to execute as planned if buying power, settlement or margin restrictions have been misunderstood.
Scalping
Scalping is one of the shortest forms of active trading. Positions can remain open for seconds or minutes, with the trader attempting to capture small movements repeatedly rather than waiting for a large trend.
A scalper might attempt to capture five cents in a liquid stock, several ticks in a futures contract or a small movement in a currency pair. Because the profit target is small, execution quality becomes central to the strategy.
Suppose a strategy targets six ticks and risks four. Losing one additional tick to entry slippage and another to the exit changes the economics dramatically. A swing trader pursuing a move hundreds of ticks long might barely notice the same difference.
This makes scalping particularly sensitive to spreads, commissions, market depth, platform speed and liquidity. A strategy that appears profitable when tested using mid market prices can fail once realistic execution costs are included.
Scalping also creates a high decision frequency. A trader making twenty or thirty decisions in one session has considerably more opportunities to deviate from their rules than somebody making two trades per week. Fatigue becomes part of the trading problem.
The style is often associated with leverage because small underlying movements produce modest profits without a reasonably large position. That creates an obvious danger. Leverage can make a small favourable movement financially worthwhile, but it does exactly the same thing to an unfavourable movement.
A scalper therefore needs to know the maximum intended loss before entering. The fact that a position is expected to last thirty seconds does not make it low risk.
Scalping is also difficult to evaluate from screenshots. A trader can show dozens of small winners without revealing the occasional large loss that removes several days of gains. The useful statistics are not merely win rate and number of profitable trades, but average win, average loss, transaction costs and the size of the worst losing sequences.
High win rates can feel reassuring while hiding poor expectancy.
Swing Trading
Swing trading operates on a slower timeframe than conventional day trading. Positions are generally held for several days or weeks while the trader attempts to capture a meaningful part of a price swing.
This allows more time for a trading thesis to develop. A swing trader might buy a stock breaking out of a multiweek consolidation, hold a currency pair through a developing macroeconomic trend or trade a pullback inside a broader index move.
Transaction costs are usually less dominant because there are fewer trades and larger price targets. Overnight risk becomes more important instead.
A stock held for two weeks may pass through an earnings announcement, analyst downgrade or unexpected corporate news. A currency trade can remain open through inflation releases and central bank decisions. Futures positions can encounter geopolitical or commodity supply shocks while the trader is away from the screen.
Stops reduce planned risk but do not guarantee an exact exit during a gap.
Swing trading can be practical for people who cannot watch markets continuously. The trader can analyse positions outside the busiest market hours and use alerts or resting orders. That does not make it passive. Open positions still require a clear risk plan and awareness of scheduled events.
The slower pace can also make analysis easier. A day trader may have seconds to respond. A swing trader can spend more time assessing structure, volatility and the distance to a sensible invalidation point.
The danger is allowing the extra time to become unlimited patience with a bad position. If a swing setup has failed, holding it for three additional months does not improve the original trade merely because the investor now calls it long term.
Trend Trading
Trend trading attempts to profit from prices continuing to move in an established direction.
The concept is straightforward. A rising market forms a sequence of generally higher prices, while a declining market moves lower. The trader attempts to participate in that movement rather than repeatedly predicting its reversal.
Trend strategies can use moving averages, breakouts, price structure, volatility bands or other rules to identify whether a directional move exists. The particular indicator is less important than defining what counts as a trend and what demonstrates that it has ended.
The difficulty is that markets spend substantial periods without clean directional movement. A trend trader can experience several small losses while price repeatedly starts moving and then reverses. The strategy depends on occasional larger winners paying for those failed attempts.
This often produces a lower win rate than newcomers expect.
Suppose a trader loses $100 on six failed breakouts and makes $400 on two successful trends. The win rate is only 25%, but the overall result is positive by $200 before costs. A trader focused only on being correct frequently may find that strategy emotionally difficult even though its arithmetic can work.
Trend trading therefore requires tolerance for false starts. Stops need to remove positions when the original directional assumption no longer makes sense without repeatedly cutting every position at the first minor retracement.
Trend following can operate intraday, across several weeks or over many months. This is why “trend trader” should not be treated as another holding period alongside day trader and swing trader. It describes the behaviour being traded.
Momentum Trading
Momentum trading has similarities with trend trading but normally places more emphasis on the strength and persistence of current price movement.
A momentum trader is interested in assets that are already moving strongly relative to their recent behaviour or to the rest of the market. A stock rising rapidly after earnings, an index accelerating after an economic release or a currency breaking through a major level can all attract momentum traders.
The reasoning is that buying and selling pressure can persist for longer than expected. Large institutional orders take time to execute, investors react to new information at different speeds and rising prices can attract additional participants.
Momentum also creates one of active trading’s biggest behavioural traps: chasing.
A strong move is not automatically a good entry. The further price has already moved, the worse the entry can become relative to a sensible stop. A trader can correctly identify the strongest stock in the market and still lose money by buying it after the move has become overextended.
This makes entry structure important. Some momentum traders enter breakouts immediately. Others wait for the first pullback, consolidation or retest. The correct approach depends on the tested strategy rather than a universal rule.
Momentum can disappear very quickly. A trade entered because buyers were aggressively lifting offers may no longer make sense once that activity stops. Traders need to distinguish between holding a position because momentum remains present and holding because they hope it returns.
The strategy is particularly popular around news and earnings because those events can cause investors to revise prices rapidly.
Mean Reversion Trading
Mean reversion starts from almost the opposite assumption to trend trading. Instead of expecting movement to continue, the trader expects an unusually stretched price to move back toward a more typical level.
The “mean” can be defined in several ways. It might be a moving average, volume weighted average price, a statistical band or another reference point. The strategy then attempts to identify moves that have become excessive relative to that benchmark.
Suppose an index normally remains within a certain range around its short term average but suddenly falls far below it without a major change in information. A mean reversion trader may buy in anticipation of price returning closer to its previous range.
The danger is obvious: sometimes an unusual move is the beginning of a major trend rather than a temporary deviation.
A stock falling sharply because its earnings outlook has collapsed is not obliged to return to yesterday’s average. What appears statistically cheap can become much cheaper as the market incorporates new information.
Mean reversion therefore needs an invalidation point just as much as momentum does. “It has fallen too far” is not enough because prices do not know how far a trader considers reasonable.
This style often generates frequent small profits when markets remain range bound and occasional larger losses when a genuine trend develops. The risk profile can therefore look like the mirror image of trend following, which often accepts repeated small losses while waiting for occasional larger gains.
Neither profile is inherently superior. The trader needs to know which one they are actually running.
Breakout Trading
Breakout trading attempts to participate when price moves beyond a level that previously contained it.
A stock might trade between $48 and $50 for several weeks. A breakout trader becomes interested when price moves above $50 with enough evidence to suggest that the previous range has ended.
The attraction is clear. Consolidation can represent a period where buyers and sellers are temporarily balanced. Once price escapes the range, new participants may enter and existing traders may adjust positions, creating a directional move.
False breakouts are common.
Price can move slightly beyond the obvious level, attract breakout orders and then reverse back into the previous range. Anyone entering late can be trapped almost immediately.
Some strategies require a close beyond the level. Others look for increased volume, a retest of the breakout point or expansion in volatility. None of those conditions guarantees success. They simply attempt to define a repeatable setup.
Breakout traders also need to account for obvious levels being visible to everyone. Stops and entry orders tend to cluster around the same areas, which can increase short term volatility when the level is crossed.
The point of the strategy is not that resistance becomes magical once a line is drawn on the chart. It is that changes in supply, demand and positioning around widely observed prices can sometimes produce follow through.
Event Driven Trading
Event driven traders build positions around information expected to change market prices.
Company earnings are a common example. A stock can move sharply after revenue, profit, guidance or management commentary differs from expectations. Economic releases such as US employment, inflation or GDP can move currencies, bonds and equity indices. Central bank decisions affect markets through both the policy decision and comments about what may happen next.
The event itself is rarely enough to predict direction. Markets react to the difference between reality and expectations.
A company can report record profit and its shares can fall because investors expected even more. Inflation can remain high while a currency weakens because the number was lower than feared. Trading the headline without knowing what was priced beforehand can therefore produce strange results.
Event driven trading also creates unusual execution risk. Prices can gap, spreads can widen and market orders can fill far from the level visible before the announcement.
A stop cannot guarantee a predefined dollar loss in those conditions.
This is why position size often needs to be smaller around events where price can jump rather than trade smoothly through each level. A trader who usually risks $200 with a stop ten cents away may discover that the next available price after unexpected news is fifty cents away.
The stop order worked. The market simply had nobody willing to transact at the intended price.
News Trading
News trading is closely related to event driven trading but can be more reactive. Rather than positioning before a scheduled release, the trader responds as new information reaches the market.
Speed matters because the most obvious interpretation of major news can be reflected in price almost immediately.
Retail traders are therefore competing in an environment where professional firms pay heavily for low latency feeds, automated analysis and execution infrastructure. Trying to beat institutional algorithms to a headline using a web browser is not a particularly attractive edge.
Retail news traders can instead focus on the price behaviour after the first reaction. Initial moves can reverse, consolidate or establish trends that last much longer than the first few seconds.
The important distinction is between trading the news and merely reading it.
The fact that a headline sounds positive does not prove the market is mispriced. Price response contains information about expectations and positioning that the headline alone does not provide.
News trading also makes source quality important. Social media rumours can move thinly traded assets before being corrected. Entering an oversized position because an anonymous account posted “breaking” information adds information risk to market risk.
Contrarian Trading
Contrarian trading means taking positions against prevailing market sentiment or price movement when the trader believes expectations have become excessive.
This is not the same as automatically selling every rising market.
Markets can remain apparently expensive or optimistic for long periods. A contrarian needs some basis for believing price has moved beyond what the underlying information justifies.
Contrarian trading often overlaps with mean reversion and valuation based approaches. A trader might buy after panic selling because liquidity rather than fundamentals appears to be driving the move, or sell an asset after speculative enthusiasm pushes valuations far beyond historical norms.
The psychological attraction can be dangerous. Calling the crowd irrational makes losing positions easier to justify. If price continues moving against the trade, the trader can simply claim everyone else has become even more irrational.
A strategy needs a point where the contrarian thesis is considered wrong.
Being early and being wrong can have exactly the same effect on an account if risk is not controlled.
Active Trading Across Stocks, Forex, Futures and Options
The same broad strategy can behave very differently depending on the market.
Stocks have company specific catalysts, exchange trading hours and individual liquidity characteristics. A momentum strategy may focus heavily on earnings, unusual volume and sector activity.
Forex trades currency pairs and is driven strongly by relative monetary policy, economic data and global capital flows. Retail OTC forex can also involve substantial leverage. The CFTC warns that leverage magnifies both gains and losses and notes that most customers at registered OTC forex dealers lose money after costs. CFTC guidance on retail forex risks
Futures provide leveraged exposure to indices, commodities, interest rates and other markets through standardised contracts. The CFTC describes futures and options trading as volatile and complex, warning that retail traders can lose all of their deposited money and, in some situations, more than the original investment. CFTC Futures Market Basics
Options add another dimension because time and volatility affect the contract price alongside the underlying asset. A trader can correctly predict the direction of a stock and still lose on an option if the move is too small, arrives too late or is outweighed by changing implied volatility.
Active traders therefore should learn the instrument as thoroughly as the strategy. A successful stock breakout method does not transfer automatically to options or futures simply because the chart looks similar.
Position Sizing Matters More Than the Trade Label
Whether somebody calls themselves a scalper, trend trader or momentum trader matters less than how much capital each trade can remove.
Position sizing starts with the amount the trader is prepared to lose if the idea fails and the price level at which the setup is no longer valid.
Suppose a trader is willing to risk $100. A stock is entered at $40 with a logical stop at $39.50, creating 50 cents of risk per share before slippage. A position of roughly 200 shares corresponds to approximately $100 of planned market risk.
If the correct stop is instead $38, the risk is $2 per share and the position should fall to roughly 50 shares if the same $100 limit remains.
This means volatility naturally changes position size.
A trader who uses the same 500 share position for every stock is not taking consistent risk. They are taking whatever amount of risk each stock happens to create.
The same principle applies to futures, currency units and options contracts, although contract values and nonlinear option behaviour make the calculations different.
Account size matters as well. Losing $500 from a $100,000 account is 0.5%. The same loss from a $5,000 account is 10%. Copying another trader’s position size without knowing their account and risk structure is therefore meaningless.
A sensible trading process asks what happens if the position loses before asking how much can be made if it wins.
Win Rate Is Not the Same as Profitability
Active traders often focus on percentage of winning trades because it is intuitive and emotionally satisfying.
It is also incomplete.
Suppose a scalper wins eight of ten trades. Each winner earns $50. The two losing trades cost $300 each. The trader has an 80% win rate and a $200 loss.
Another trader wins four of ten. Each winner makes $250 and each loss costs $100. The win rate is only 40%, but the strategy makes $400 before costs.
Expectancy depends on average win, average loss and their respective probabilities.
This becomes particularly relevant when comparing active trading styles. Mean reversion systems can produce high win rates and occasional large losses. Trend systems can lose frequently but rely on fewer large winners. Scalping can generate many modest outcomes where transaction costs determine whether a small theoretical edge survives.
No win rate is inherently good without the rest of the distribution.
Traders should also distinguish strategy performance from execution performance. A good strategy can produce a losing period through normal variance. A profitable market environment can temporarily make a poor process look intelligent.
A sufficiently long and comparable sample is required before either conclusion becomes persuasive.
Transaction Costs Can Decide Whether Active Trading Works
Frequent trading magnifies small costs.
Each transaction can involve a bid ask spread, commission, exchange or regulatory fees, financing and slippage. Some markets advertise zero commission while generating broker revenue elsewhere in the transaction.
A trader making 500 round trips per month experiences costs very differently from an investor buying an index fund twelve times per year.
Suppose a strategy produces an average gross profit of $8 per trade across 1,000 trades. That looks useful until the combined average commission, spread and slippage amounts to $7. The actual edge is $1 per trade.
A small deterioration in execution would remove it.
Backtests therefore need realistic costs. Using the midpoint of every historical bid and ask can create fills that would never have been available in live trading. Assuming every stop fills at exactly the intended price creates the same problem.
Shorter term strategies are generally more sensitive because the target price movement is smaller relative to friction.
This is one reason scalping is difficult despite producing large numbers of apparent opportunities. The market does not need to defeat the strategy by much. Costs can do it.
Leverage Changes the Speed of the Result
Leverage allows traders to control market exposure larger than the capital committed as margin.
This can make active trading capital efficient, particularly in futures and forex. It can also make ordinary market fluctuations financially extreme.
The SEC warns that margin increases purchasing power but can produce larger losses, forced liquidation and interest expenses. Investor.gov guidance on margin accounts notes that brokers can sell securities to meet margin requirements and may impose requirements stricter than regulatory minimums.
Leverage is not a trading edge.
If a strategy loses 10 cents per dollar traded before leverage, increasing the position makes the loss larger rather than fixing the method. Leverage only becomes useful after position risk has already been defined.
This is particularly important for small accounts. Traders can become tempted to use large leverage because ordinary percentage gains on a small capital base do not produce much money. The result is often that an inexperienced trader takes larger percentage risks than a professional with considerably more capital.
A small account does not need more leverage nearly as much as it needs time to avoid being destroyed while the trader is still learning.
Active Trading Psychology
Active trading creates rapid feedback, and rapid feedback can encourage poor decisions.
After a loss, the next trade can feel more important because it has the potential to recover the money. After a large win, the next trade can feel safer because the trader is operating with recent profits.
Neither feeling changes the probability of the setup.
Revenge trading begins when recovering the previous loss becomes part of the reason for entering the next position. The trader may increase size, lower their quality threshold or take a market they would normally ignore.
Overconfidence creates the same outcome from the opposite direction. Several winners can make normal variance feel like improved skill, encouraging the trader to take larger risk precisely when confidence is least objective.
A predefined maximum loss for the day or session can help interrupt this cycle. The particular number is less important than having a point where the trader stops solving a poor trading day by placing more trades.
Boredom is another underestimated problem. Active traders spend substantial amounts of time waiting. The market does not provide valid setups according to an employee timetable.
A trader who feels required to trade because they have been sitting at the screen for three hours eventually lowers the standard.
Doing nothing is part of active trading, despite the name.
Building an Active Trading Process
A useful process is narrow enough to measure.
Choose a market, timeframe and setup. Define what needs to happen before entry, where the trade is considered wrong and how position size will be calculated. Decide whether exits are based on fixed targets, trailing stops, changing market structure or another repeatable rule.
Then collect comparable trades.
A trader who takes one breakout, one mean reversion setup, two news trades and a speculative option position has not produced five observations of one strategy. They have produced five unrelated outcomes.
Paper trading can help with the early stage. It allows the trader to learn the platform, understand order types and test whether the strategy can be executed as intended without losing money to operational errors.
Simulation has limits. A paper loss does not create the same emotional response as a real one, and simulated fills may be better than live execution.
Small real positions therefore provide a different kind of information.
The first live objective should not be replacing employment income. It should be demonstrating that the strategy and risk rules can still be followed when the account balance actually changes.
A journal then records what happened. Entry, exit, stop, size, setup and outcome are useful, but the distinction between planned trades and rule violations matters even more. A losing trade following every rule is not the same problem as a trade that lost because the stop was ignored.
Without that distinction, traders frequently change their strategy to solve what is actually a discipline problem.
Which Type of Active Trading Is Best?
There is no single trading style that dominates across all traders and markets.
Scalping can suit someone who wants very short exposure and can maintain concentration while making many decisions. It demands excellent execution and makes costs particularly important.
Day trading removes most overnight position risk but requires enough screen time and discipline to operate inside a compressed decision window.
Swing trading allows more time for analysis and can fit around another occupation, but positions remain exposed to overnight gaps and financing where applicable.
Trend trading can capture large movements but often requires accepting multiple failed attempts before one trend pays for them.
Momentum trading participates in strength but can become chasing if entries are poorly controlled. Mean reversion can perform well in range bound conditions and suffer badly when a real trend emerges.
The best fit is partly behavioural. A trader who cannot tolerate frequent small losses may struggle with certain trend strategies. Someone unable to hold a position through normal overnight fluctuations may find swing trading miserable even if the strategy has a positive expectancy.
Available time matters as well. A person with a full time job cannot realistically trade every movement in the first hour of the New York session unless their work schedule permits it.
Capital, market access and transaction costs impose another set of constraints.
Trading style should therefore emerge from a combination of evidence and practical fit rather than from whichever strategy produced the most impressive recent screenshot.
Active Trading Is a Business of Small Advantages
Active trading does not require predicting every market movement. It requires finding a repeatable situation where the combination of average wins, average losses and probabilities remains positive after trading costs.
That edge can come from trend persistence, short term overreaction, momentum, event interpretation or another market behaviour. Whatever the source, it is normally smaller and less stable than promotional trading material suggests.
Markets change. Volatility changes. Other traders adapt. Transaction costs change and strategies become crowded.
An active trader therefore needs enough discipline to distinguish normal losing periods from evidence that the method has stopped working.
That is why the basic work remains unglamorous. Measure results, control position size, include actual costs and stop treating each individual trade as a verdict on personal intelligence.
Scalping, day trading, swing trading, trend following and mean reversion can all be legitimate active approaches. None removes uncertainty.
The difference between structured active trading and random speculation is not how often the trader clicks Buy or Sell. It is whether there was a defined reason for entering, a known amount at risk and enough evidence to believe that repeating the same decision makes financial sense.